Introduction
MCT Berhad, now Avaland Berhad, is a Malaysian property developer working across residential, commercial and mixed-use projects. The company engaged Walk Production to design its 2021 annual report.
The brief was to present its financial performance, board governance, development portfolio and management analysis in a structured format, communicating both current achievements and the company’s growth direction to shareholders and market analysts.
The corporate reporting design scope covered conceptualisation, art direction, layout design and infographic development. The report carried data tabulation, financial highlights, management discussion and analysis, and board of directors profiles across its content and financial reporting chapters.
Our Solutions
Concept and cover design
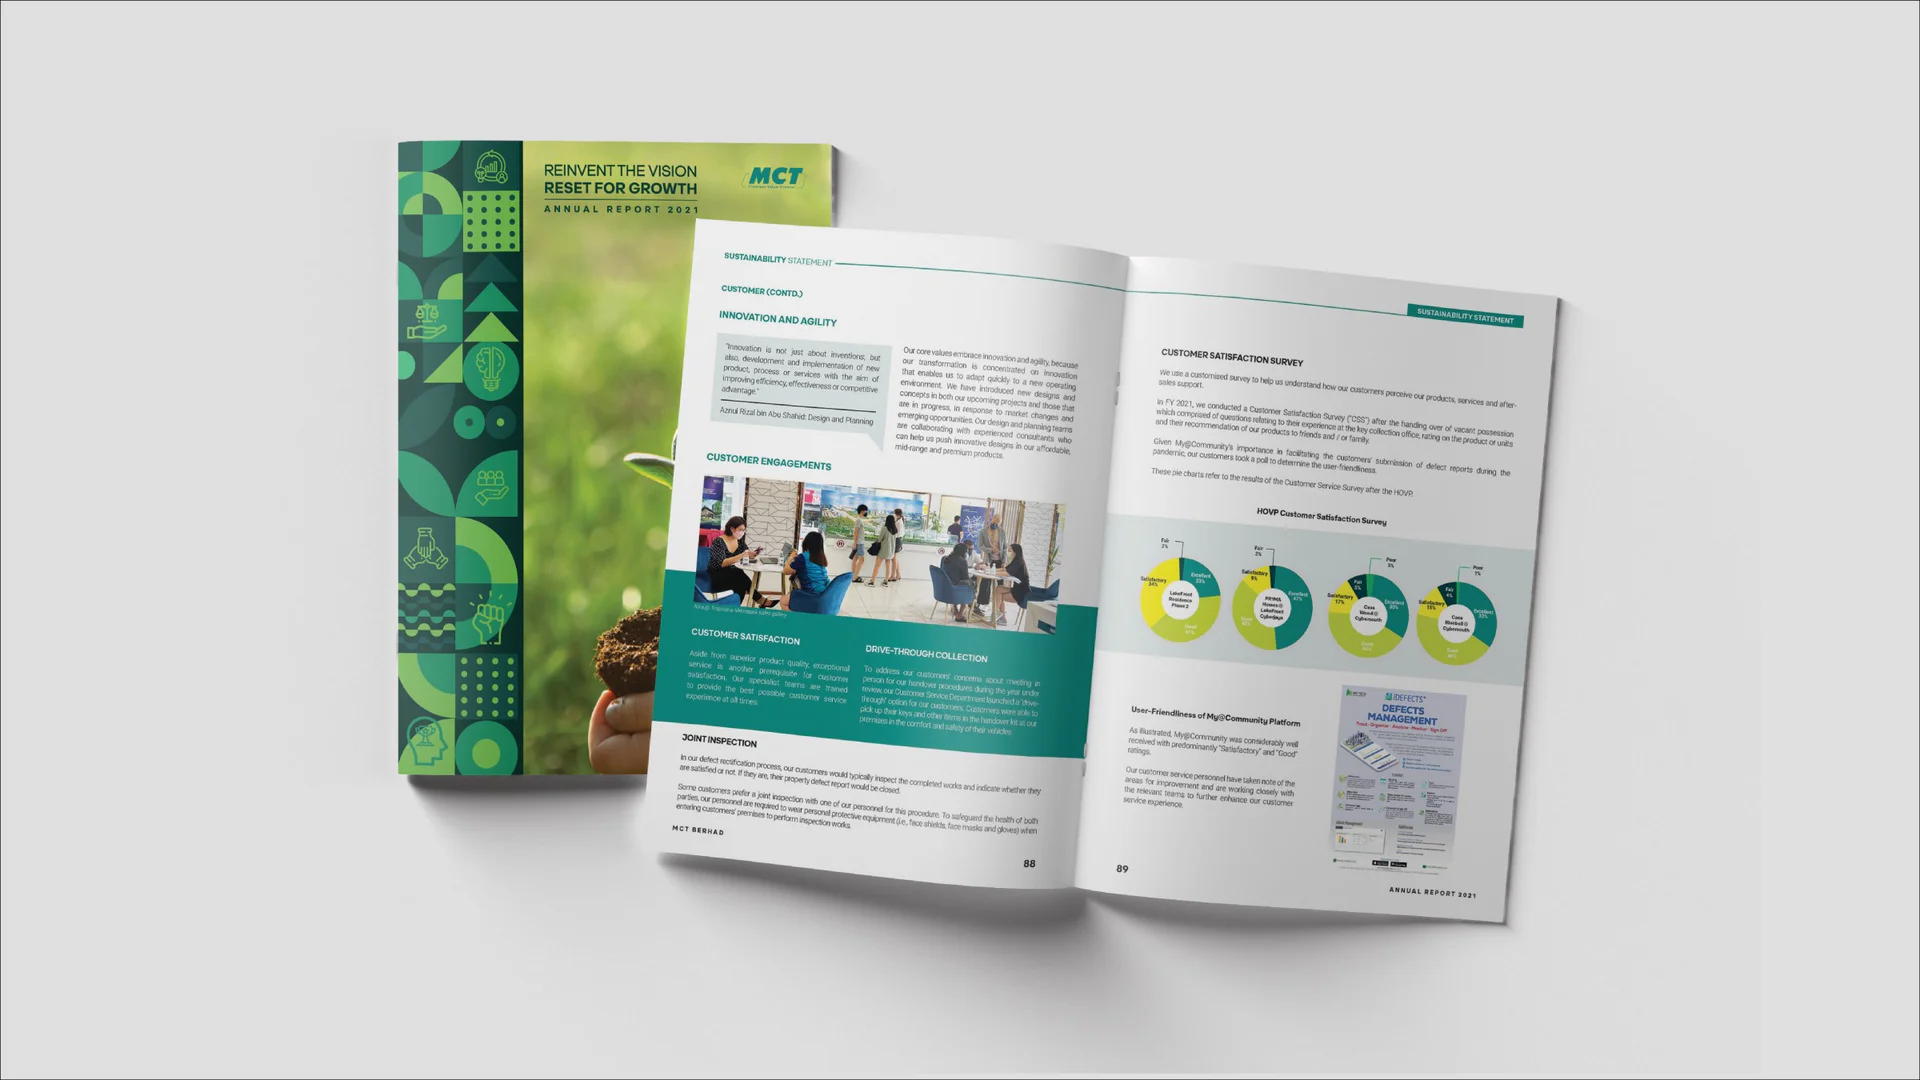
The design concept was built around the report’s theme, Reinvent the Vision, Reset for Growth. The cover sets a column of geometric icons in greens beside a photograph of a seedling held in open hands, pointing to renewal and to the company’s plans for its property portfolio.
The same greens and geometric icon style carry into the sustainability chapter’s section headers, extending the cover’s system past the front page.
Layout design and financial presentation
The annual report layout was structured to handle the content set: financial tabulation, management discussion, board profiles and a development portfolio. Each section followed a consistent design system that held visual coherence across diverse content types and data formats.
Financial data was presented through structured tables and supporting visual elements that highlight performance metrics for shareholders and market analysts. The layout accommodated detailed financial statements alongside narrative content without compromising readability or data precision. Clear typographic hierarchy and colour-coded sections supported quick navigation through the report’s corporate, technical and governance content areas.
Infographic design and data visualisation
Custom property report infographic design elements were developed to present financial highlights, operational milestones and development portfolio data in visual formats. The graphic design used charts, comparison graphics and visual callouts to summarise key indicators across operational areas. Each infographic was designed to sit within the report’s overall visual system.
The property portfolio section featured project showcases with photography and key specifications, providing stakeholders with a visual record of completed and ongoing developments across the company’s operating areas. Each project was presented with location context, development type and completion status. The section serves both shareholder and marketing-adjacent reading purposes within the annual report.
The Results
The completed annual report presents MCT Berhad’s financial performance and development portfolio through a design concept tied to the company’s growth ambitions. The publication communicates corporate achievements with a visual clarity that supports both quick reference and detailed reading for shareholders and market observers.
The report organises financial and operational data in a structured format that serves shareholders, analysts and industry stakeholders. It provides a record of the company’s development portfolio, governance practices and financial position for the reporting period.
Related Questions
What does the Reinvent the Vision, Reset for Growth cover on the MCT Berhad annual report represent?
The cover pairs a column of geometric icons in greens with a photograph of a seedling held in open hands. Together they point to renewal and to the growth the company was planning for its property portfolio. The same greens and icon style continue into the sustainability chapter’s section headers.
Why use a thematic design concept on a Bursa-listed annual report like MCT Berhad’s?
A standardised corporate template gets the report out the door but does not give the publication a distinct identity for shareholders to remember. A thematic concept ties the cover, chapter dividers, infographics and section openers into one read, which is what supports engagement when shareholders work through the report alongside the formal financial statements.
What sits inside the MCT Berhad annual report?
Financial statements, management discussion and analysis, board profiles, corporate governance disclosures, a development portfolio section and supporting infographics. The structure follows what shareholders, analysts and industry stakeholders look for when reviewing a property developer’s annual position and growth direction.
Why include a development portfolio section in MCT Berhad’s annual report?
The development portfolio is what shareholders are also reading for: where the capital has gone, what has been completed and what is in progress. Featuring projects with photography, location context, development type and completion status gives stakeholders a visual record alongside the financial position. It serves both the corporate-reporting and the marketing-adjacent reading at the same time.
How does infographic design support MCT Berhad’s financial story in the annual report?
Infographics summarise financial highlights, operational milestones and portfolio data into visual callouts that surface key trends. Standard financial tables stay in place for the analysts who need them, while the infographic layer makes the same data accessible at a glance for readers who are scanning the report instead of working through it in detail.