Introduction
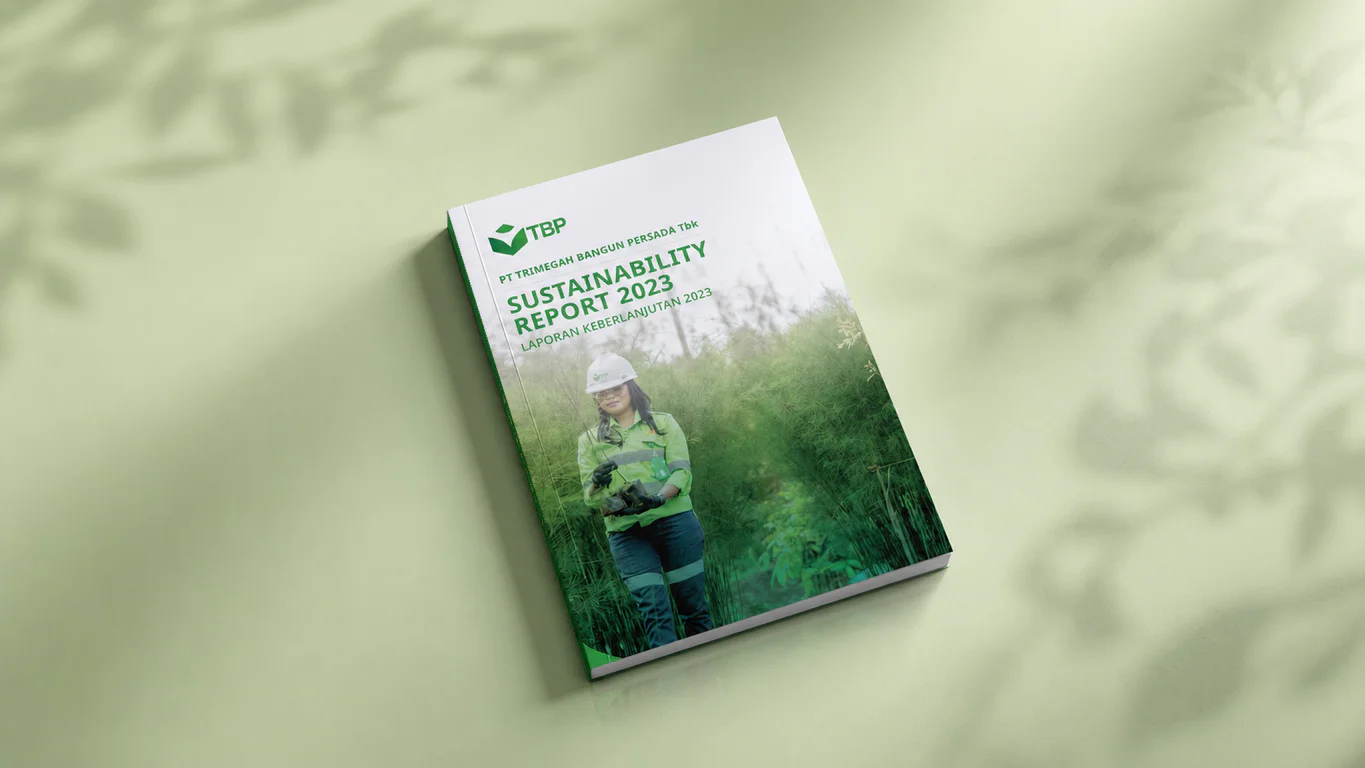
PT Trimegah Bangun Persada Tbk (TBP) is an Indonesia-based nickel mining company involved in mineral extraction and processing. Walk Production was brought in to design and produce its 2023 sustainability report, covering concept development, data visualisation, bilingual layout, and project coordination.
TBP’s sustainability report needed to cover environmental and social performance while meeting both local disclosure standards and international stakeholder expectations. The report had to present complex operational data in an accessible format for diverse reader groups.
Our full ESG report design scope covered information architecture, layout production, and milestone-based project management.
Our Solutions
Conceptualisation and information architecture
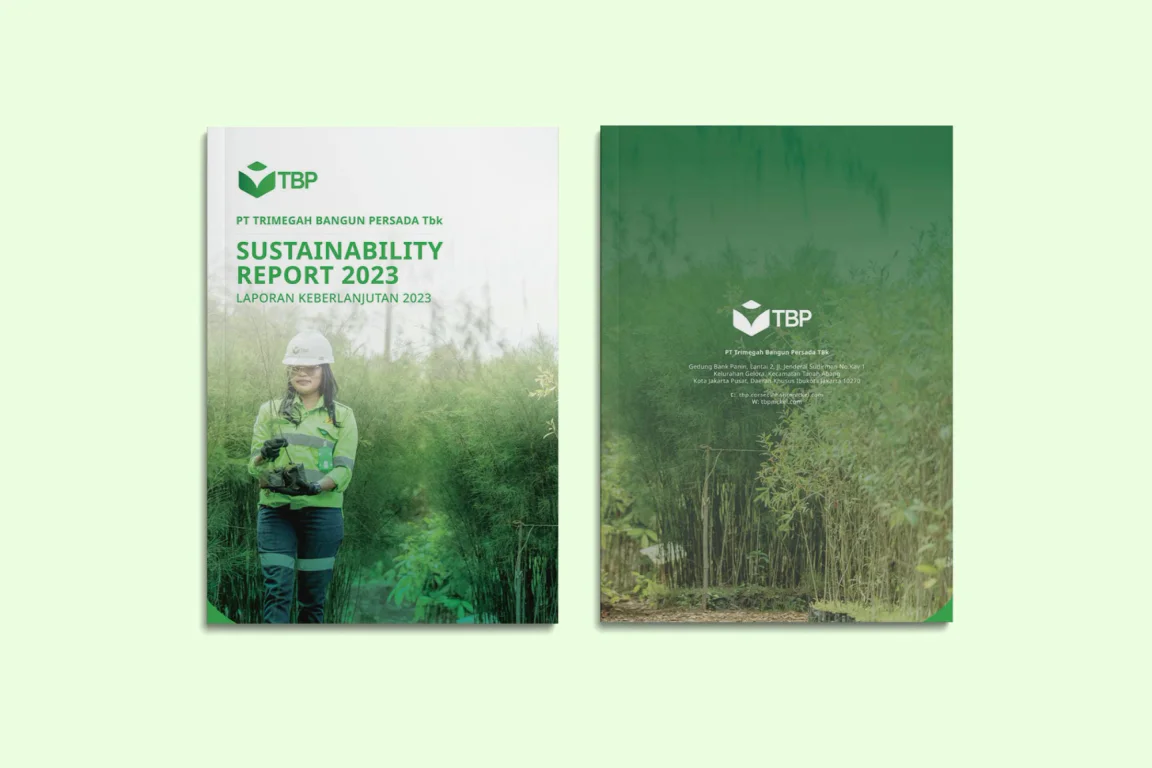
The report’s concept was built around TBP’s position as a responsible resource operator in an ecologically sensitive region. We developed a visual narrative that balanced technical mining data with environmental stewardship messaging. Natural imagery and earth-toned palettes connect industrial operations with their geographic setting.
Information architecture was critical for this project. We mapped out reporting boundaries across the group’s subsidiaries so the content clearly shows which entities are covered and how their data aggregates at the group level. That clarity matters in mining-sector reports, where operational boundaries can be complex.
Layout and graphic design
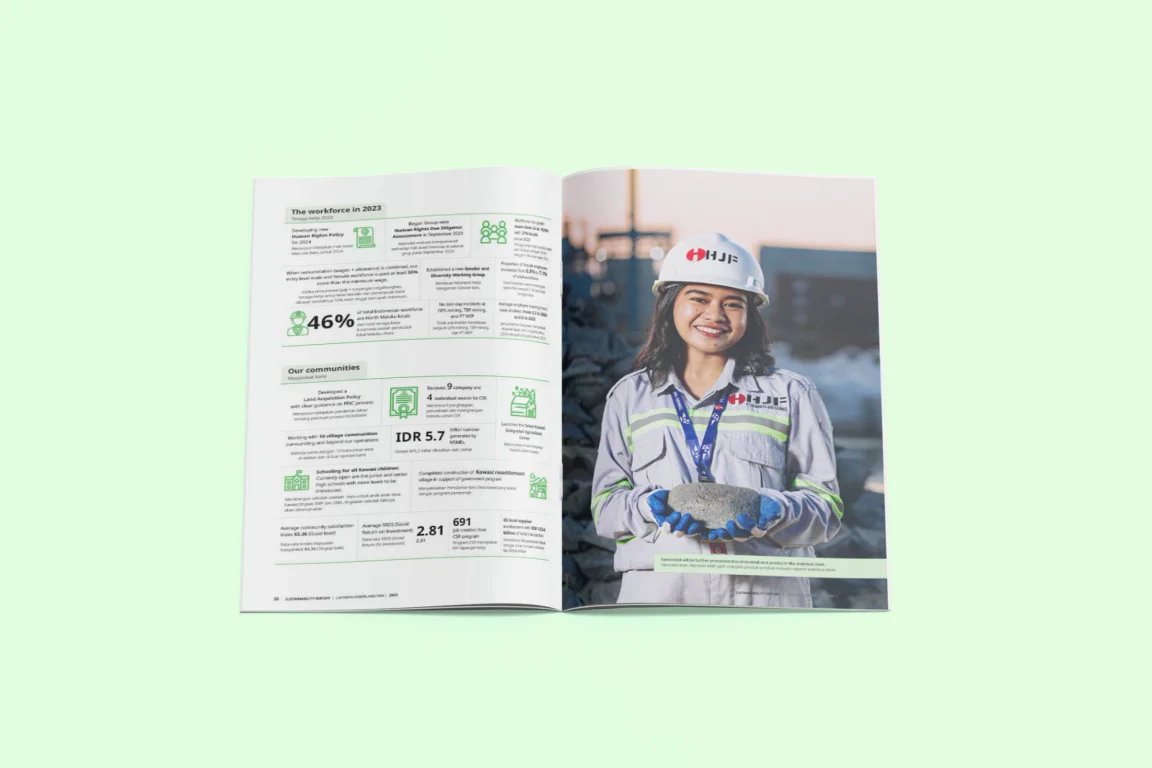
Page layouts were designed to handle dense technical content, including geological data, emissions figures, and community development metrics, while staying accessible to non-specialist readers. Section dividers using client-supplied operational imagery provide geographic context and visual contrast against the data-heavy spreads.
The report includes bilingual content in Bahasa Indonesia and English. Our grid system accommodated both languages without requiring separate editions. Parallel text blocks and carefully calibrated typography maintain readability across language pairs on every spread.
Data visualisation and project coordination
Mining sustainability data can be particularly challenging to visualise. We created a suite of custom data graphics that standardise how different data types appear throughout the report. This gives readers a consistent visual vocabulary for interpreting performance metrics across all sections.
Cross-border project management between our team and TBP’s team required disciplined scheduling and clear communication protocols. We coordinated content collection, translation workflows, and design reviews through structured milestone-based editorial project delivery to keep the timeline on track.
The Results
PT TBP’s sustainability report delivered a professional disclosure document that serves both regulatory compliance and stakeholder communication needs. The bilingual format supports transparency across the company’s operations for corporate and investor audiences.
The structured information architecture and consistent data visualisation approach established a reporting template. TBP can build upon this foundation in future editions, maintaining continuity while updating content year on year.
Project Gallery
Related Questions
What makes mining sustainability reports different from other industries?
Mining reports typically include environmental monitoring data, biodiversity assessments, community development updates, and safety performance metrics. The technical nature of this data requires specialised visualisation approaches and clear reporting boundaries for each operational site.
Can Walk Production handle bilingual sustainability report layouts?
Yes. We regularly design reports with dual-language content, using grid systems and typographic approaches that accommodate parallel text. Languages include English, Bahasa Indonesia, Bahasa Malaysia, and Mandarin.
How does Walk Production manage cross-border report projects?
We use structured milestone-based workflows with defined review stages, version-controlled file sharing, and scheduled coordination calls. This approach works effectively for projects spanning Malaysia, Indonesia, and other regional markets.
What is data visualisation in the context of ESG reporting?
Data visualisation translates raw ESG metrics into charts, infographics, and visual summaries that communicate trends at a glance. Good visualisation helps readers quickly grasp complex information like emissions data, workforce statistics, or supply chain metrics.
Does Walk Production design sustainability reports for Indonesian companies?
Yes. Walk Production works with companies in Malaysia and Indonesia, including Indonesian entities, through our professional ESG report design service. We accommodate local regulatory requirements, bilingual content needs, and stakeholder expectations in our design process.